AI Revolutionizes Diabetes Diagnosis in India: A Doctors’ Adoption Model
Newsletter
Subscribe now to get notified about IU Nagaland Journal updates!
Search
AI Revolutionizes Diabetes Diagnosis in India: A Doctors’ Adoption Model
Mrinmoy Roy
Research Scholar
Mittal School of Business
Lovely Faculty of Business & Arts,
Lovely Professional University,
Phagwara, Punjab, India
Abstract
This study aims to investigate the factors influencing doctors' decisions to adopt AI-based diabetes diagnostic interventions in urban Maharashtra and Karnataka, India. These regions have a high prevalence of diabetes, and AI has the potential to improve diagnostic accuracy and efficiency. The research design is based on a survey of doctors using the Technology Acceptance Model (TAM) framework. The survey measures doctors' perceptions of usefulness, ease of use, subjective norms (social influence to use the technology), and perceived risks associated with AI-based diagnostic tools. The study finds that perceived usefulness and ease of use have a positive influence on doctors' intentions to adopt AI-based diagnostic tools. Subjective norms, such as the recommendations of colleagues and superiors, also play a significant role. However, perceived risks related to data security and practitioner knowledge can hinder adoption. The findings suggest that increasing awareness of the benefits of AI-based diagnostics and addressing concerns about data security and practitioner training can promote doctor adoption. This can lead to earlier and more accurate diagnoses, improved patient outcomes, and reduced healthcare costs. This research is one of the first to examine the factors influencing doctor adoption of AI-based diabetes diagnostics in the Indian context. The findings provide valuable insights for policymakers, healthcare institutions, and AI developers to promote the effective integration of AI into diabetes care in India. The study acknowledges limitations, such as relying on self-reported data and not capturing the actual usage behaviour of doctors. Future research could explore longitudinal studies and investigate the impact of interventions designed to address doctors' concerns.
Keywords
artificial intelligence, adoption, technology acceptance model, subjective norms, user experience, diabetes diagnosis
Introduction
The Indian healthcare system faces many challenges, including a shortage of qualified professionals, uneven distribution of resources, and a growing population. India has the world's largest diabetic population, with Maharashtra and Karnataka having many cases (Roy & Jamwal, 2020). Early and accurate diagnosis is essential for effective management. Traditional diagnostic methods can be time-consuming and prone to human error. AI-based interventions have the potential to improve accuracy and efficiency (Ghosh & Murthy, 2020). Artificial intelligence (AI) has emerged as a promising solution, potentially transforming healthcare diagnostics and improving patient outcomes. While studies suggest the transformative potential of AI in diagnostics (Bangdiwala, 2020; INDIAai, 2024), there exists a gap between awareness and adoption of AI tools among doctors in India (Ghosh & Murthy, 2020). Understanding the factors influencing doctors' decision-making regarding the adoption of AI-based diagnostic tools is vital for promoting successful integration within the healthcare system. Maharashtra and Karnataka have distinct healthcare ecosystems, and their unique considerations may influence the adoption of AI-based diagnostic tools. Several studies highlight the potential benefits of AI in diagnostics, such as addressing unequal access to care, reducing misdiagnosis rates, and improving overall patient care (Bangdiwala, 2020; INDIAai, 2024; Reddy et al., 2022). However, there is a lack of research specifically examining the factors that drive or hinder doctors' adoption of AI-based diabetes diagnostic interventions in these states. With this view, the authors propose to investigate the factors influencing doctors' decisions to adopt AI-based diabetes diagnostic interventions in urban Maharashtra and Karnataka. This research can identify factors specific to these regions, enabling targeted interventions to increase AI adoption. The findings can contribute to the existing literature on technology acceptance models in healthcare by exploring the specific context of AI-based diabetes diagnosis in India.
Literature Review
Several studies have examined the adoption of artificial intelligence (AI) in healthcare in developing nations like India. This paper (Mahajan et al., 2019) highlighted India's strengths such as an emerging talent pool and the availability of big data from clinical imaging to drive AI adoption. However, the authors noted weaknesses like lack of trained personnel, data curation issues, and high costs as barriers. Their recommendations to enable smoother AI adoption included creating a national AI marketplace, raising awareness, supporting startups, and addressing data privacy. Girish Kumar et al. (2024), identify 18 barriers that a country like India is facing in the successful adoption of AI into healthcare. These range from Lack of acceptance and trust by patients, Lack of Explainability, Lack of understanding of complex AI algorithms, High adaptation cost of AI and reduced profits for hospitals, and so on. The authors call out the need for a regulatory framework to ensure the smooth integration of AI in healthcare in India.
TAM was created by Davis et al. (Davis et al., 1989) to clarify why users accept or reject a cutting-edge information system. TRA was developed by Fishbein and Ajzen (Fishbein et al.,1975) to predict and explain employee behaviour. TAM emphasizes the impact of internal and external beliefs, and it suggests that system utilization can be justified in terms of perceived usefulness and ease of use. The internalization effect, which is referenced in both TRA and TAM, suggests that one's attitude, subjective norms, constructs of the TRA model, and perceived utility and perceived ease of use in TAM may all be impacted by one's purpose to utilize and perception of the usefulness of a technology. In both models, behaviour intention is influenced by attitude. According to Davis, the influence of subjective norms on behavioural intention to use could be disregarded, hence TAM did not take these variables into account. However, Venkatesh and Davis (Venkatesh et al., 2000) examined these variables in the TAM2 extension. In terms of explanatory power, TAM only accounts for 40%–50% of technology adoption (Aversano, 2005), although Davis notes that TAM2 exceeds 60% (Venkatesh et al., 2000). Contrary to many other TAM study scenarios where certain behaviour is primarily based on people's internal motivations, accepting and implementing Subjective Norms is primarily social. Those who use SNS will perceive managing social networks with SNS as a typical trend; as a result, its broad use is projected to encourage users to partake in the same activity. In this regard, the current study explores how the subjective norm contributes to the acceptance and use of SNS; it is predicted that someone who views the use of Subjective Norms as normative will have stronger inclinations to engage in Subjective Norms. The subjective norm, by TAM, influences behavioural intention, which in turn affects how people act—accepting and employing Subjective Norms.
The effects of "subjective norm," "voluntariness," and "image" are reflected in TAM2. The interaction between the three components is a crucial element in determining whether users would accept or reject an innovative system. One of the elements of TRA is "subjective norm," which is a crucial element of the theoretical underpinnings of TAM and a direct predictor of behavioural intention. According to TAM 2, subjective norm, which is defined as "a person's view that most people who are significant to him think he should or should not execute the behaviour in question" (Cheng J-Z et al., 2016), is the medium via which social influence processes take place. The impact of the subjective norm is acknowledged in the Theory of Planned Behavior (TPB) (Ajzen, 1991). In a study on subjective norms, Venkatesh and Davis (Venkatesh et al., 2000) discovered that different ways to use innovative systems should be distinguished. To differentiate usage contexts into mandatory and voluntary settings, the concept of "voluntariness" was suggested. The moderating variable for voluntariness in TAM2 is set to "the extent to which potential adopters consider the adoption decision to be non-mandatory" (Agarwal et al., 1997; Hartwick et al., 1994; Moore et al., 1991). Hartwick and Barki (Hartwick et al., 1991) noted that even when users believe that using the system is required by the company, usage intentions can still differ since some users are unwilling to follow such requirements. When a group that is significant to a person believes that a particular behaviour should be adopted, this belief is referred to as "image" (Kiesler et al., 1969; Pefeffer, 1982; Kieras et al., 1985). When this behaviour is adopted by the individual, it can consistently improve the quality of internal work produced by the organization. The four cognitive instrumental processes in TAM2—"job relevance," "output quality," "outcome demonstrability," and "perceived ease of use"—are what determine perceived usefulness. A crucial aspect of the matching process is "job relevance," which asks a potential user to assess how utilizing a specific system will affect his or her employment. It is described in TAM2 as "a person's perspective of the extent to which the target system applies to his/her job." According to Kieras and Polson (Kieras et al., 1985) and Polson (Polson, 1987), different users have different levels of knowledge about employment conditions, which can be utilized to assess what tasks can be carried out within a particular system. The definition of "output quality" is "the level to which a person evaluates the impact of a new system." In other terms, it refers to how much a person believes a new system can do necessary duties (Lin, 2005). According to TAM2, perceived usefulness will be directly influenced by "outcome demonstrability," which is described by Moore and Benbasat (Moore et al., 1991) as the "tangibility of the effects of using the innovation." This suggests that if positive results are obvious, consumers will have a more favourable opinion of a system's usefulness. In other words, users of a system may credit their success to work behaviour rather than system utilization if the result demonstrability of the system is low. As a key factor in determining "perceived utility," TAM2 maintains "perceived ease of use" from TAM. An innovative system will be utilized more often if it can be operated with less effort. This is in line with how perceived ease of use is defined. Numerous empirical research has shown that perceived ease of use strongly influences both intentions to use and perceived usefulness, both directly and indirectly (Davis et al., 1989; Venkatesh, 1999). Other research investigations have started to develop models and hypotheses based on perceived ease of use, even if they are outside the purview of the current expansion of TAM. Additionally, "experience" was included in TAM2 by Venkatesh and Davis (Venkatesh, 1999) as a moderator variable. With further experience, users' acceptance of an innovative system may change. Thus, the three-time intervals at which their acceptance was tested—before system implementation (before use), one month after system implementation (during use), and three months after system implementation—were all considered (after use). Subjective norm has a considerable impact on user intentions before system creation, but Hartwick and Barki (Hartwick et al., 1994) note that three months after system installation, the impact may become insignificant. Users should have a particular level of knowledge and beliefs about the system before it is constructed. A wide range of opinions may be put out if the knowledge or beliefs are hazy (Hartwick et al., 1994). Users must increase their understanding of the system after it is improved. TAM (Davis, 1988) and TAM2 (Venkatesh and Davis, 1986) have been continuously investigated and used since 1989. However, the majority of earlier research that applied TAM2 to creative systems concentrated mostly on the precursors of perceived utility.
For the use-case of this paper, TAM was ultimately chosen over other theoretical models, such as UTAUT and TPB, because of its nature to focus on whether a user accepts or rejects a technology. Whereas other models focus on the acceptance and usage of technology and the cognitive and psychological aspects of technology respectively. For these reasons, TAM was chosen as the primary theoretical framework to understand the adoption of AI in Diabetes diagnosis.
Conceptual Model & Hypotheses Development
The Factors
Perceived Usefulness: This refers to how much a person thinks utilizing a certain information technology or system will improve how well they do their jobs. In other words, a person's attitude toward using a new technology or system will depend on how valuable they consider it to be.
Perceived Ease of Use: This refers to how user-friendly one perceives a specific information technology or system to be. In other words, the more positively someone feels about using a new technology or system, the easier they believe it to be to use.
Behavioural Intention to Use: A user's behavioural intention to use a new system is influenced by his or her mindset and the system's perceived value. Perceived utility and perceived ease of use are regarded as standard measures with significant values based on the experience and research of numerous researchers (Segars et al., 1998). As a result, there are many ways that these tools might be used to learn information technology (Adams et al., 1992).
Perceived Risk: The Technology Acceptance Model has undergone theoretical expansions in its application to incorporate several other predictor variables in addition to perceived usefulness and ease of use. Included in one of the additions is Perceived Risk (Pavlou, 2003). The degree to which a person thinks using a technology exposes them to risk has been described as the technology's perceived risk (see Schnall, Bakken, Rojas, Travers, & Carballo-Dieguez, 2015). According to the Technology Acceptance Model, intentions to utilise a certain technology decline as perceived risk rises.
Subjective Norms: Subjective norms are the perceived social pressures and motivations to engage in a particular behaviour (Hyde & White, 2009). According to the theories of self-categorization and social identification (Hogg & Abrams, 1988; Tajfel & Turner, 1979), people evaluate themselves about their memberships in social groups and categories.
Therefore, a key source of the self-concept is self-inclusive social groupings that define the appropriate attitudes and behaviours for group members (Hogg & Abrams, 1988; Tajfel & Turner, 1979). These theories contend that people may choose to take a course of action they feel they ought to even if they disapprove of the results as evidence for subjective norm (Venkatesh & Davis, 2000).
According to Teo (2009), which is consistent with this line of research, felt social pressure was strongly correlated with a person's behavioural intentions. The impacts of subjective norms on technology use were examined by Marcinkiewicz and Regstad (1996), who found that the subjective norm was the best predictor of computer use along with self-competence, perceived relevance, and innovativeness. The subjective norm was acknowledged as a crucial element in determining how instructors, school authorities, and students use technology by Sugar, Crawley, and Fine (2004) in a related study.
Proposed Hypothesis
H1: Perceived Usefulness has a positive influence on the Behavioural Intention of AI-based diabetes diagnostic interventions by Doctors.
H2: Perceived Ease of Use has a positive influence on the Behavioural Intention of AI-based diabetes diagnostic interventions by Doctors.
H3: Subjective Norms have a positive influence on the Behavioural Intention of AI-based diabetes diagnostic interventions by Doctors.
H4: Perceived Risk has a negative influence on the Behavioural Intention of AI-based diabetes diagnostic interventions by Doctors.
H5: Perceived Ease of Use has a positive influence on Perceived Usefulness.
Methodology
There are lots of studies promoting the use of available technologies and their adoption models in healthcare, but there is no such study available for measuring the adoption of AI-based diabetes diagnostic interventions among doctors and that too in the Indian context. The researchers hereby conducted an observational investigation of Doctors’ adoption of AI-based diabetes diagnostic intervention, this research aims to create a proposed model of adoption and test the validity of the model. Diabetologists, Endocrinologists, MD Physicians and General Practitioners who used an AI-based diabetes diagnostic intervention made up the research group. For objects containing the TAM constructs and other features, a five-point Likert scale ranging from 1 (strongly disagree) to 5 (strongly agree) was used. Respondents were asked to provide input on AI-based diabetes diagnosis intervention, its impact on doctors' attitudes toward use, and behavioural intention to use. To check the quality and efficiency of the calculation model, the data were evaluated using the Statistical Package for the Social Sciences (SPSS) and Structure Equation Modeling (SEM). Factor loadings were used to ensure construct validity, composite reliability, Cronbach's alpha, and convergence validity for the model's goodness of fit, as recommended by Hair et al. (2012).
Instruments of Measurement
The Questionnaire constructs adopted from earlier research works confirmed measurement scales’ material validity. There were two sections of the sample questionnaire: Basic demographic data (gender, age, educational level, place) and questionnaire items measuring machine self-efficacy and subjective norm were adapted from (Cohen & Nycz 2006), as were items measuring perceived risk, perceived usefulness, perceived ease of use, attitude toward use, and behavioural intention to use were adapted from Davis (1989); Al-Rahmi et al. (2019).
Data Analysis and Result Discussion
The Cronbach's alpha reliability coefficient was found to be Perceived Usefulness = 0.911, Perceived Ease of Use = 0.808, Subjective Norms = 0.839, Perceived Risk = 0.866 and Behavioural Intention = 0.854 indicating that the variables that affected the behavioural intention to use an AI-based diabetes diagnostic intervention by doctors were reliable. Three criteria were used to assess discriminant validity: According to Hair et al. (2012), variable indices must be less than 0.70, the Average Variance Extracted (AVE) of each construct must be equal to or greater than 0.5, and the AVE square root of each construct must be greater than the Inter-Construct Correlations (IC) for a factor. Aside from the above factors, build factor analysis results with factor loadings of 0.70 or greater (Cronbach's alpha 0.70 and composite reliability 0.70) are sufficient (Hair et al., 2012).
Construct validity of Measurements
Construct validity (Alamri et al., 2020) refers to the degree to which individual objects assess the definition for which they were created. This was measured using a systematic analysis of previously reviewed products in the literature. Table 2 lists the items and their loadings, which are required to load into the construct that they were designed to test (Chow & Teicher, 2012).
Table 2: Measurement items reliability and validity indicators
Construct |
Factor loading |
Items |
|
Perceived Usefulness
|
.914
.913
.908
.915
.914
.910
.926 |
AI-based Diabetes diagnostic devices would help me to cope with preventable Diabetes diseases and their complications at an early stage. |
|
Perceived Ease of Use Cronbach α = 0.834
|
.840 .698 |
I find the instructions for AI-based Diabetes Diagnostic devices easy, clear, and understandable. |
|
Subjective Norms Cronbach α = 0.925
|
.894
.865
. |
People who are important to me (Colleagues, family members, relatives, and close friends) think that I should use AI-based Diabetes diagnostic devices. |
|
Perceived Risk Cronbach α = 0.887 |
.853
.847
.858
.861 |
There is a possibility of malfunction and performance failure, so they might fail to deliver accurate diagnoses or recommendations which could increase conflicts between members of the public and medical institutions. |
|
Behavioural Intention Cronbach α = 0.927 |
.908
.906
.909
.915
.906
.934 |
I intend to use AI-based Diabetes diagnostic devices as my first choice if I feel my patients need them. |
Perceived Ease of Use:
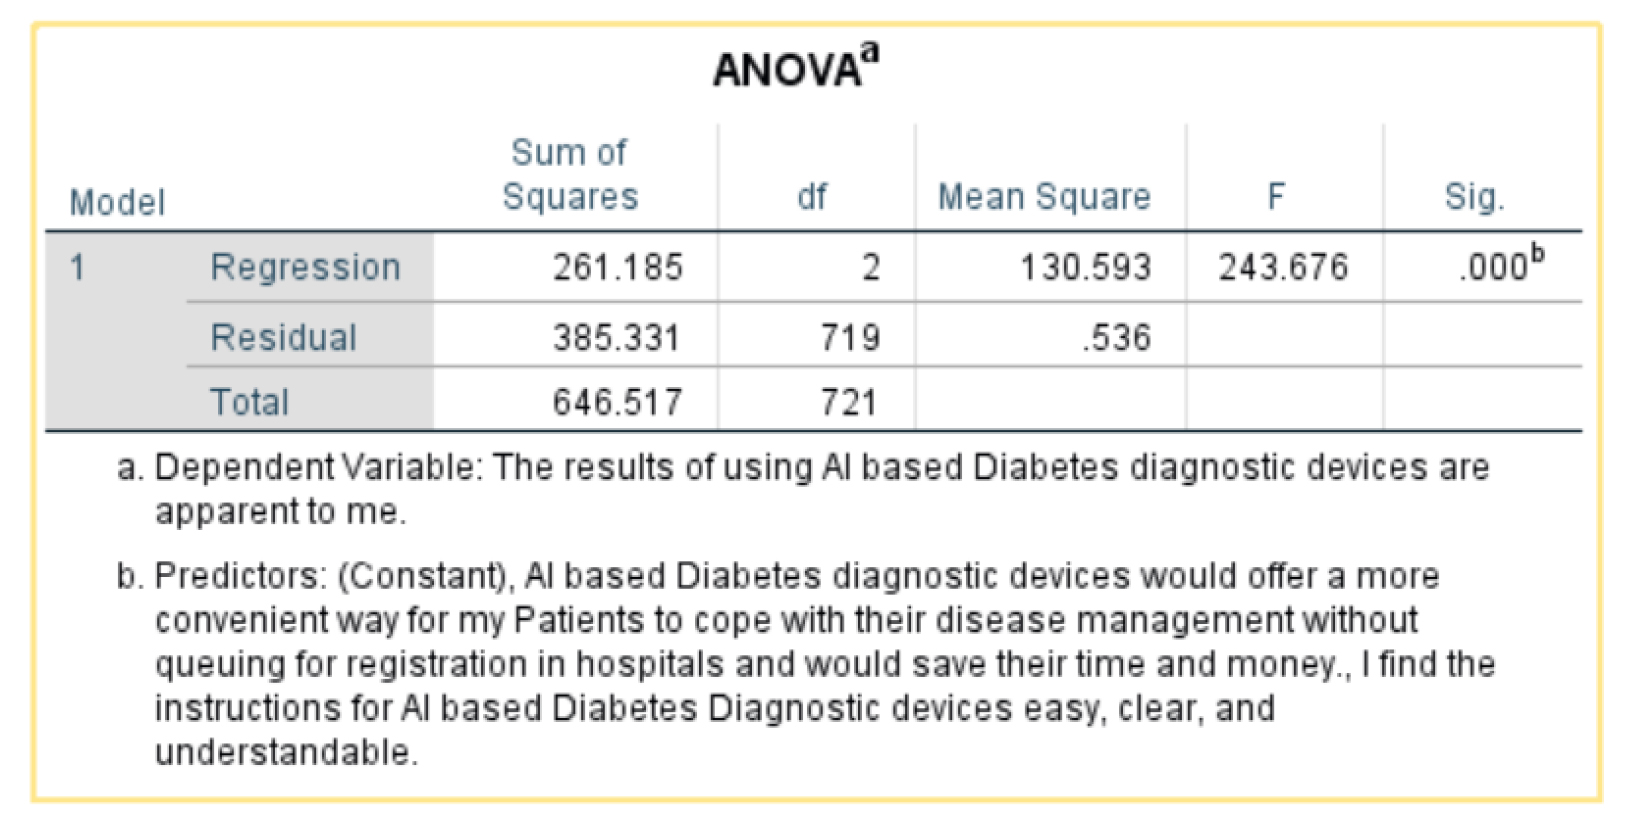
- Independent variable: Al-based Diabetes diagnostic devices would offer a more convenient way for my patients to cope with their disease management without queuing for registration in hospitals and would save them time and money.
- Dependent variable: The results of using Al-based Diabetes diagnostic devices are apparent to me. (behavioural intention)
The statistic R-squared is a measure of how well the variation in the dependent variable is explained by the independent variable. An R-squared of .404 means that 40.4% of the variation in the dependent variable is explained by the independent variable.
This is the p-value. A p-value less than 0.05 indicates that the null hypothesis can be rejected with 95% confidence. In other words, it is statistically significant.
The p-value in the table is 0.000b, which is less than 0.05. This means that we can reject the null hypothesis and conclude that there is a statistically significant difference between the means of the two groups.
Overall, the ANOVA suggests that there is a difference between the way people who agree and disagree with the statement view the apparentness of the results of using AI-based diabetic diagnostic devices. However, the table does not show which group has the higher mean score.
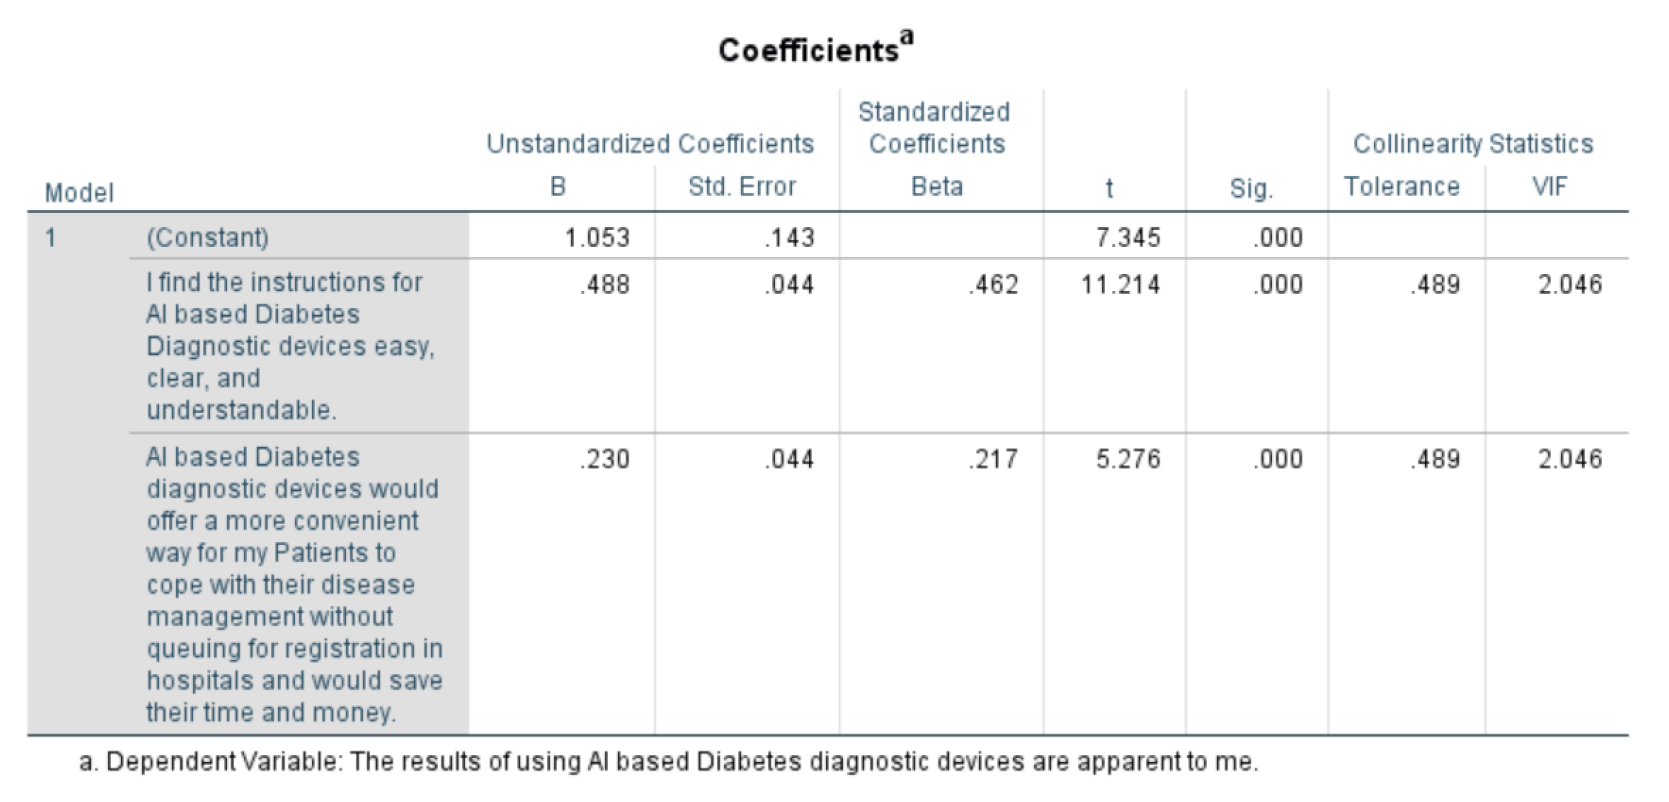
Sig. is the p-value associated with the t-statistic. A p-value less than 0.05 indicate that the relationship between the independent variable and the dependent variable is statistically significant.
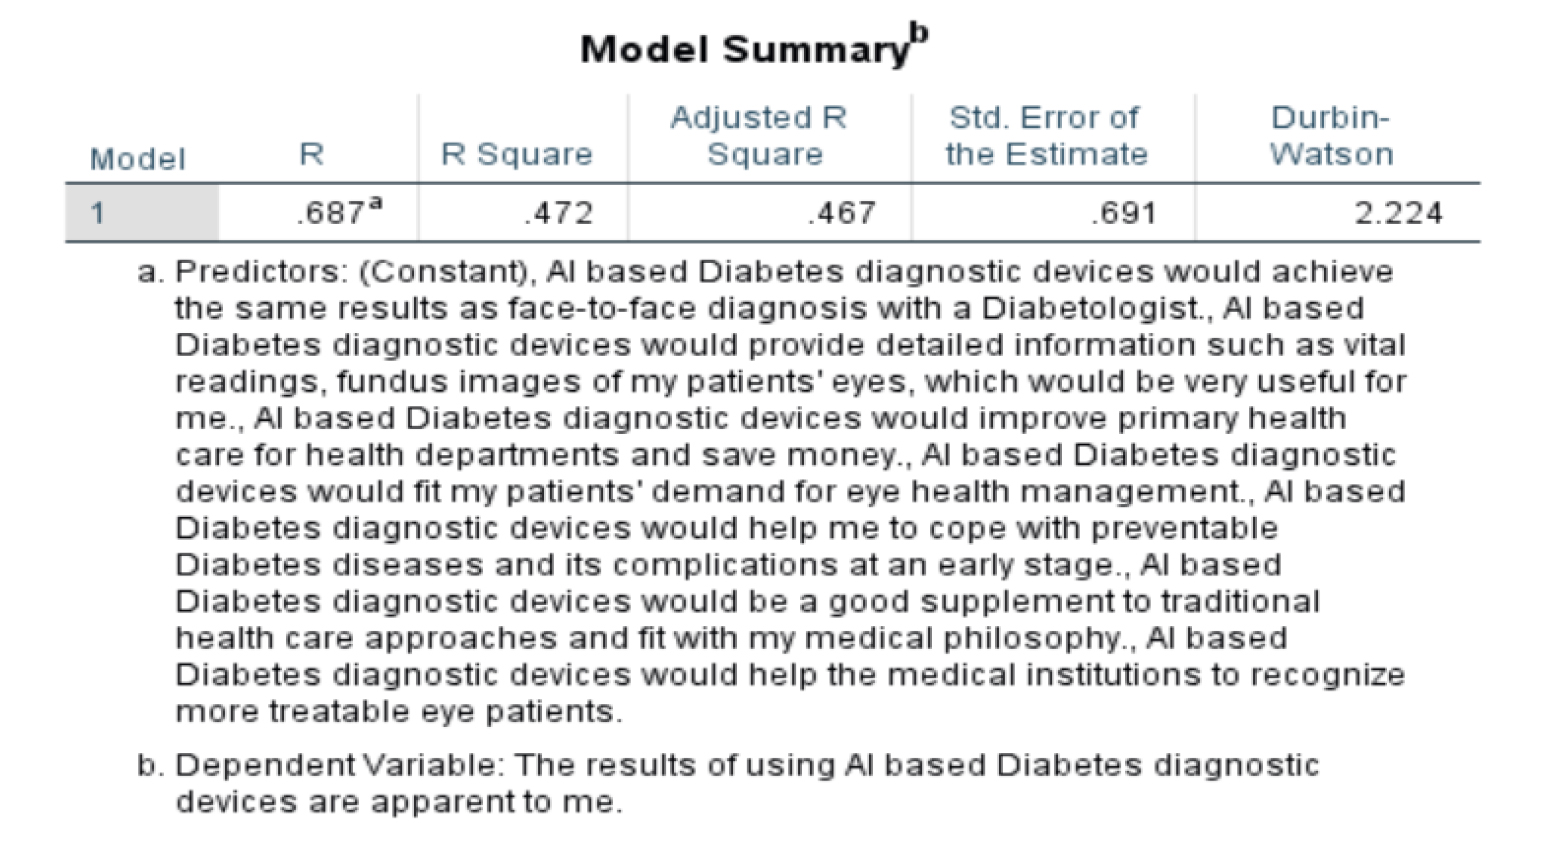
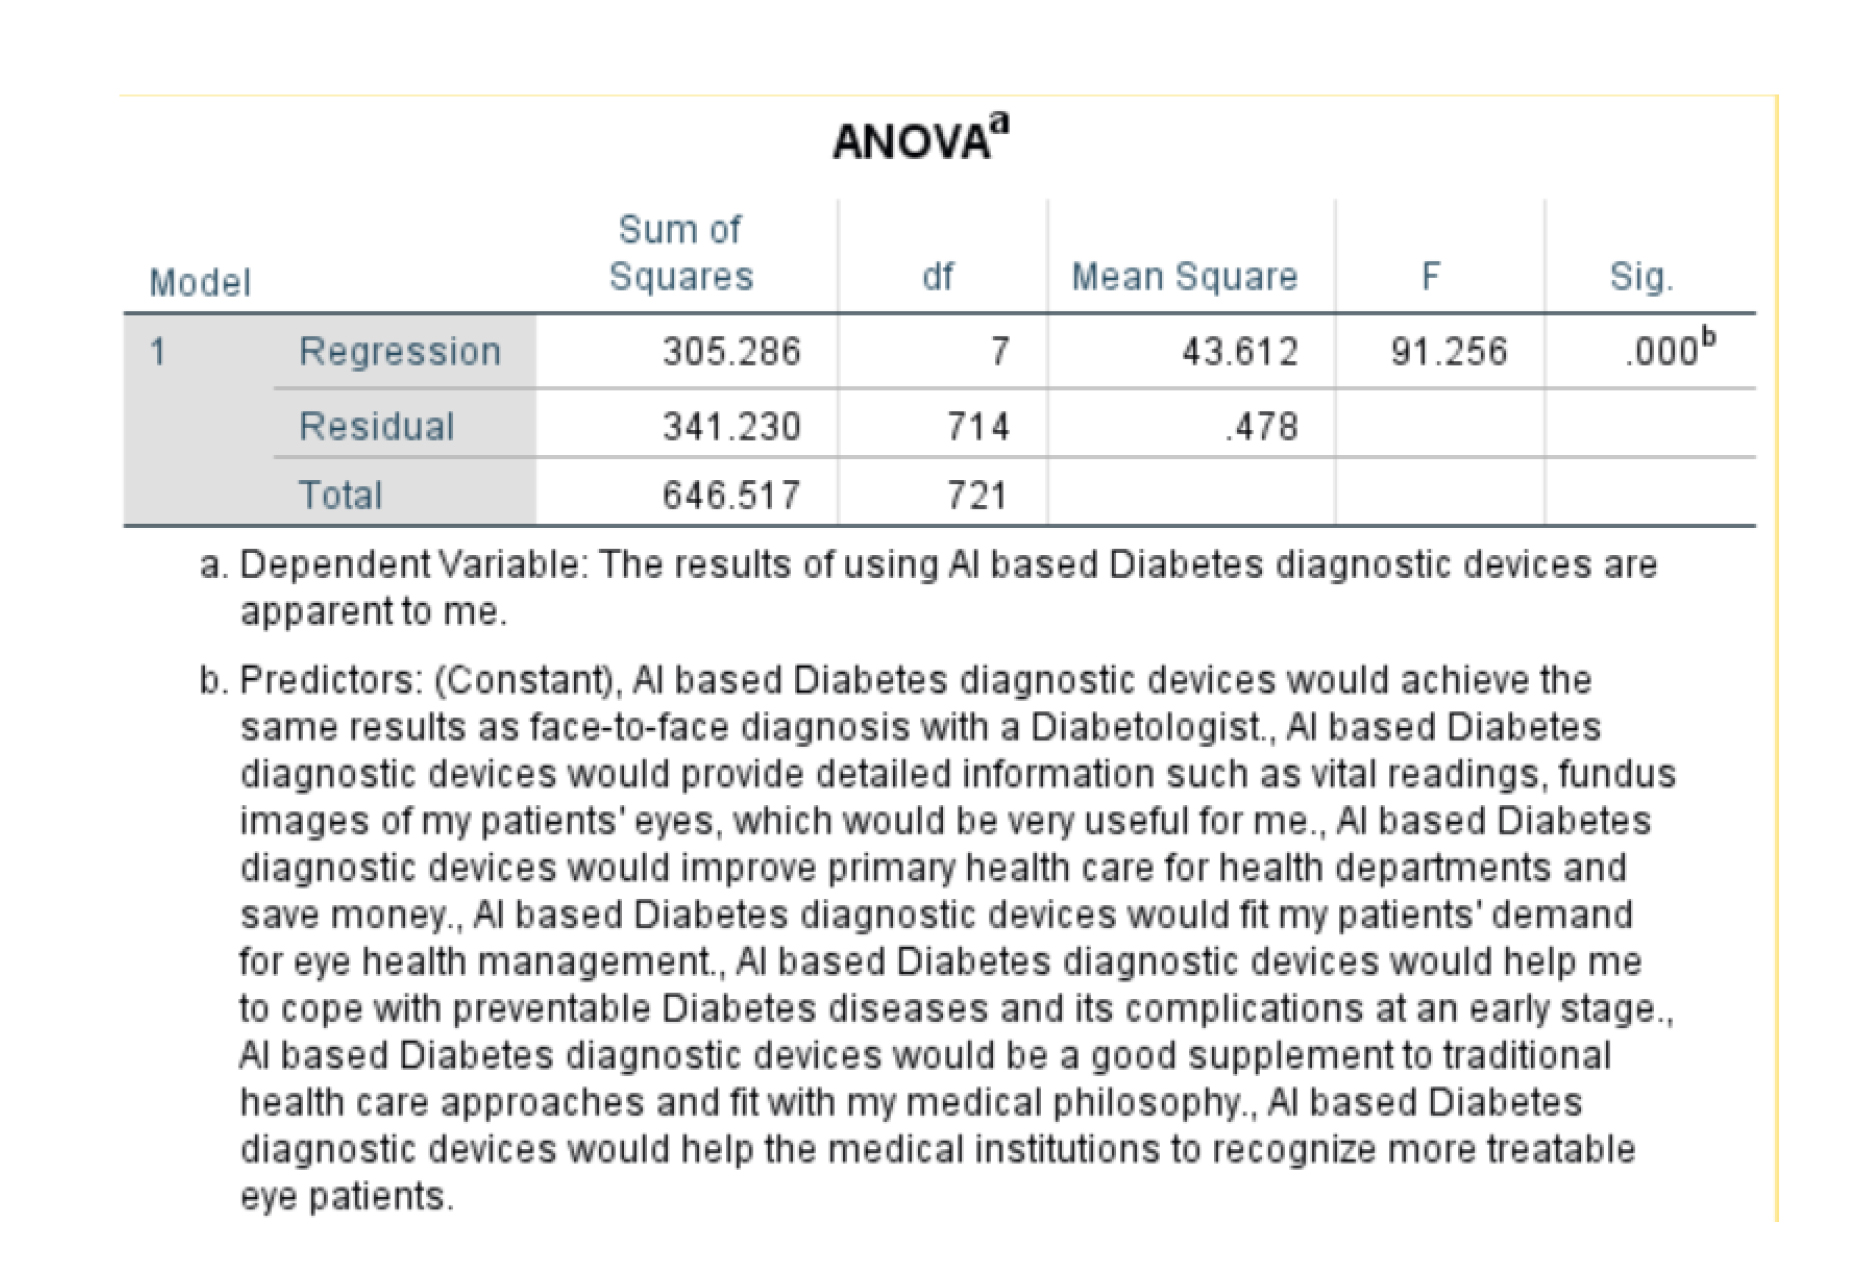
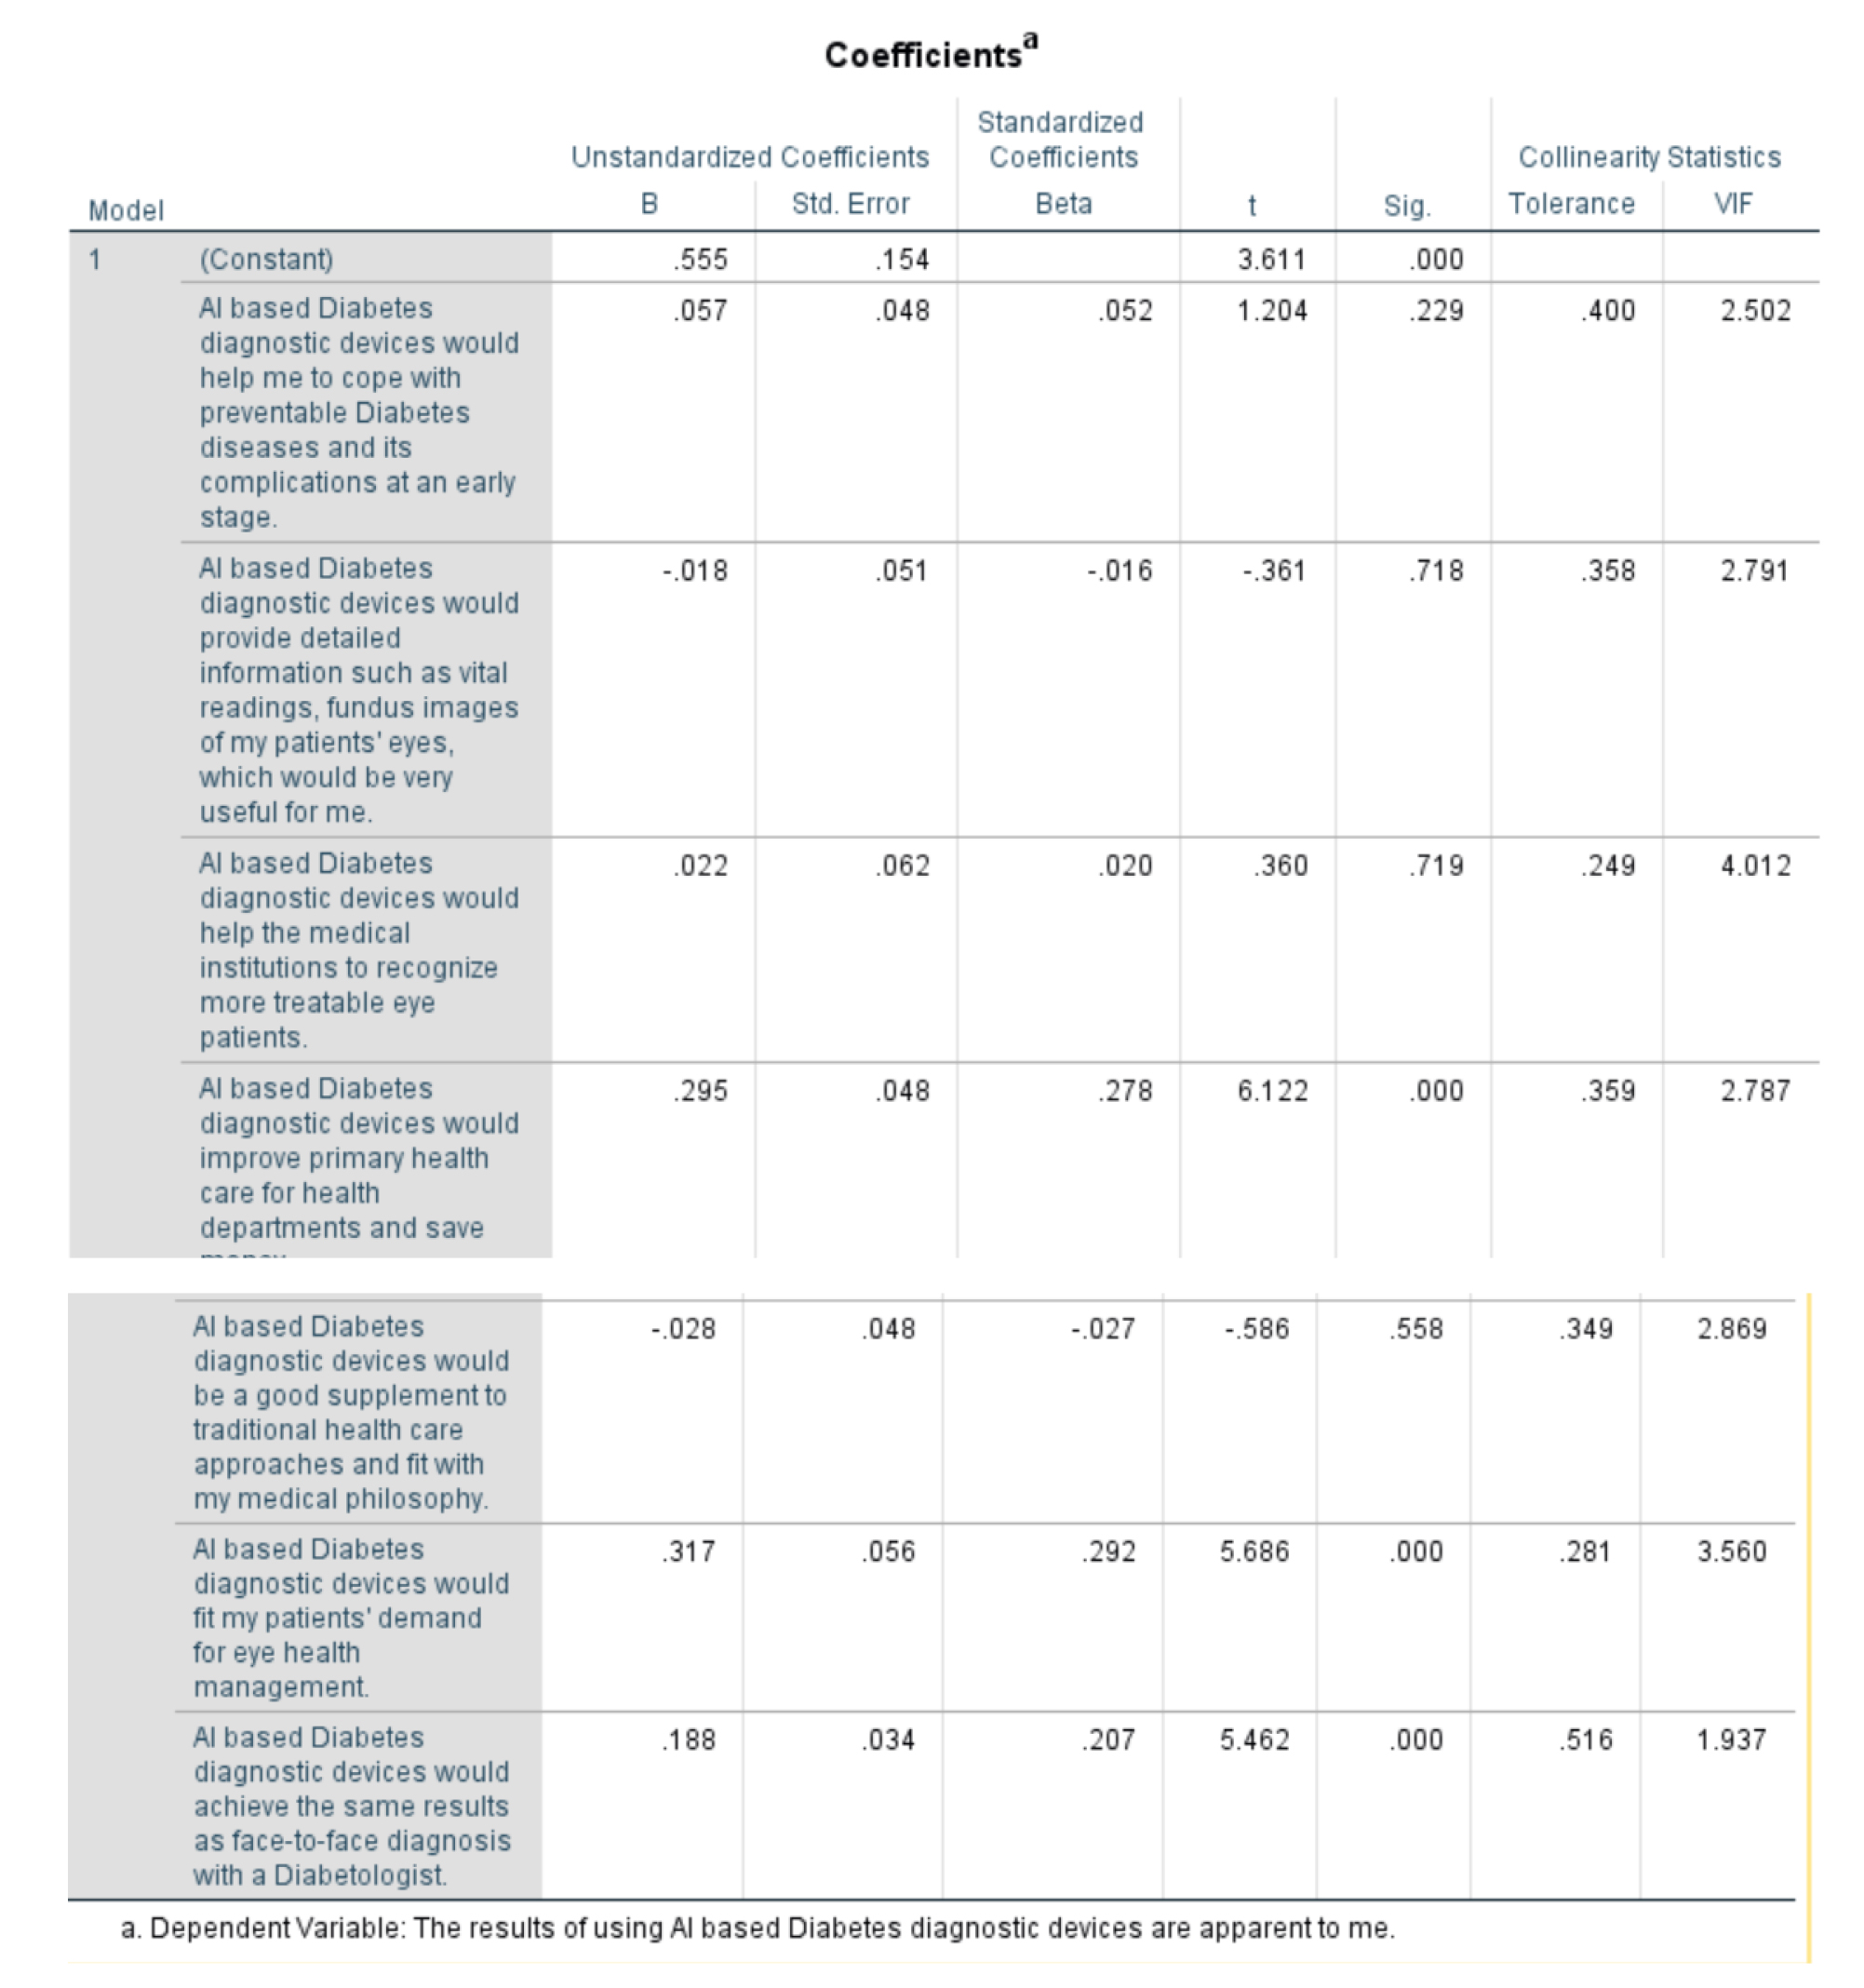
Perceived Usefulness:
R Square (R²) is the squared value of R. It represents the proportion of variance in the dependent variable that is explained by the independent variables in the model. A value of 0.472 means that 47.2% of the variance in how well patients understand the results is explained by the model.
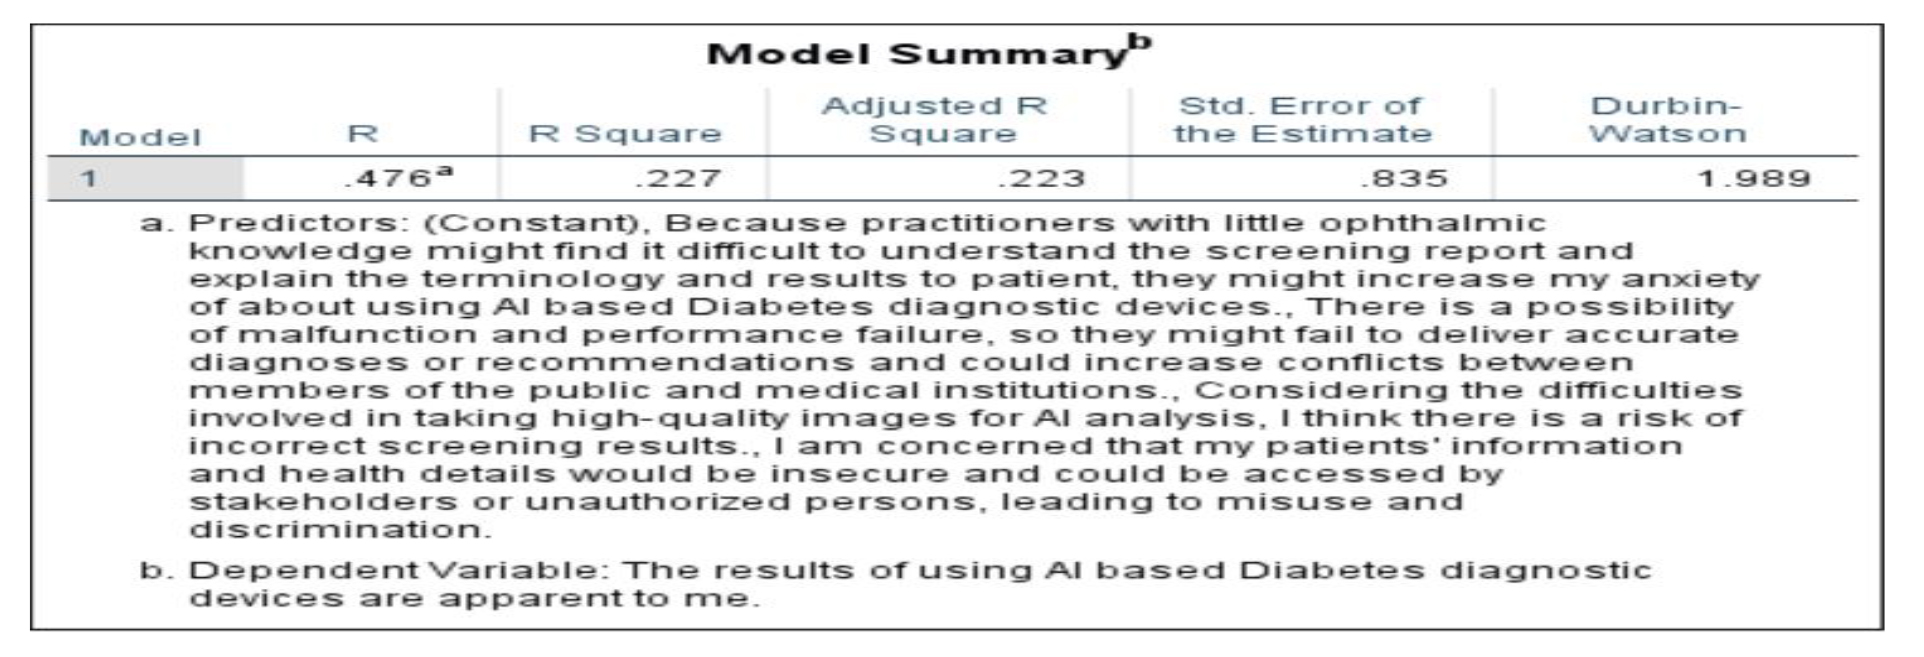
Durbin-Watson is a statistic used to test for autocorrelation in the residuals. Autocorrelation is a serial dependence in the residuals, which can violate the assumptions of linear regression. The value in the table is 2.010, which is within the acceptable range.
The table shows that there is a statistically significant difference (p-value < .000) between the groups on the dependent variable, which is the result of using AI-based diabetes diagnostic devices. This means that the factors related to the use of AI-based diabetes diagnostic devices have a significant impact on the results of the devices thus the null hypothesis can be rejected.
These factors are significant here as from the table as their factors are less than 0.05 thus these 3 are impacting the dependent variable
VIF (Variance Inflation Factor): This is another measure of collinearity. A VIF value greater than 5 suggests potential multicollinearity, which can affect the reliability of the regression coefficients.
Subjective Norms
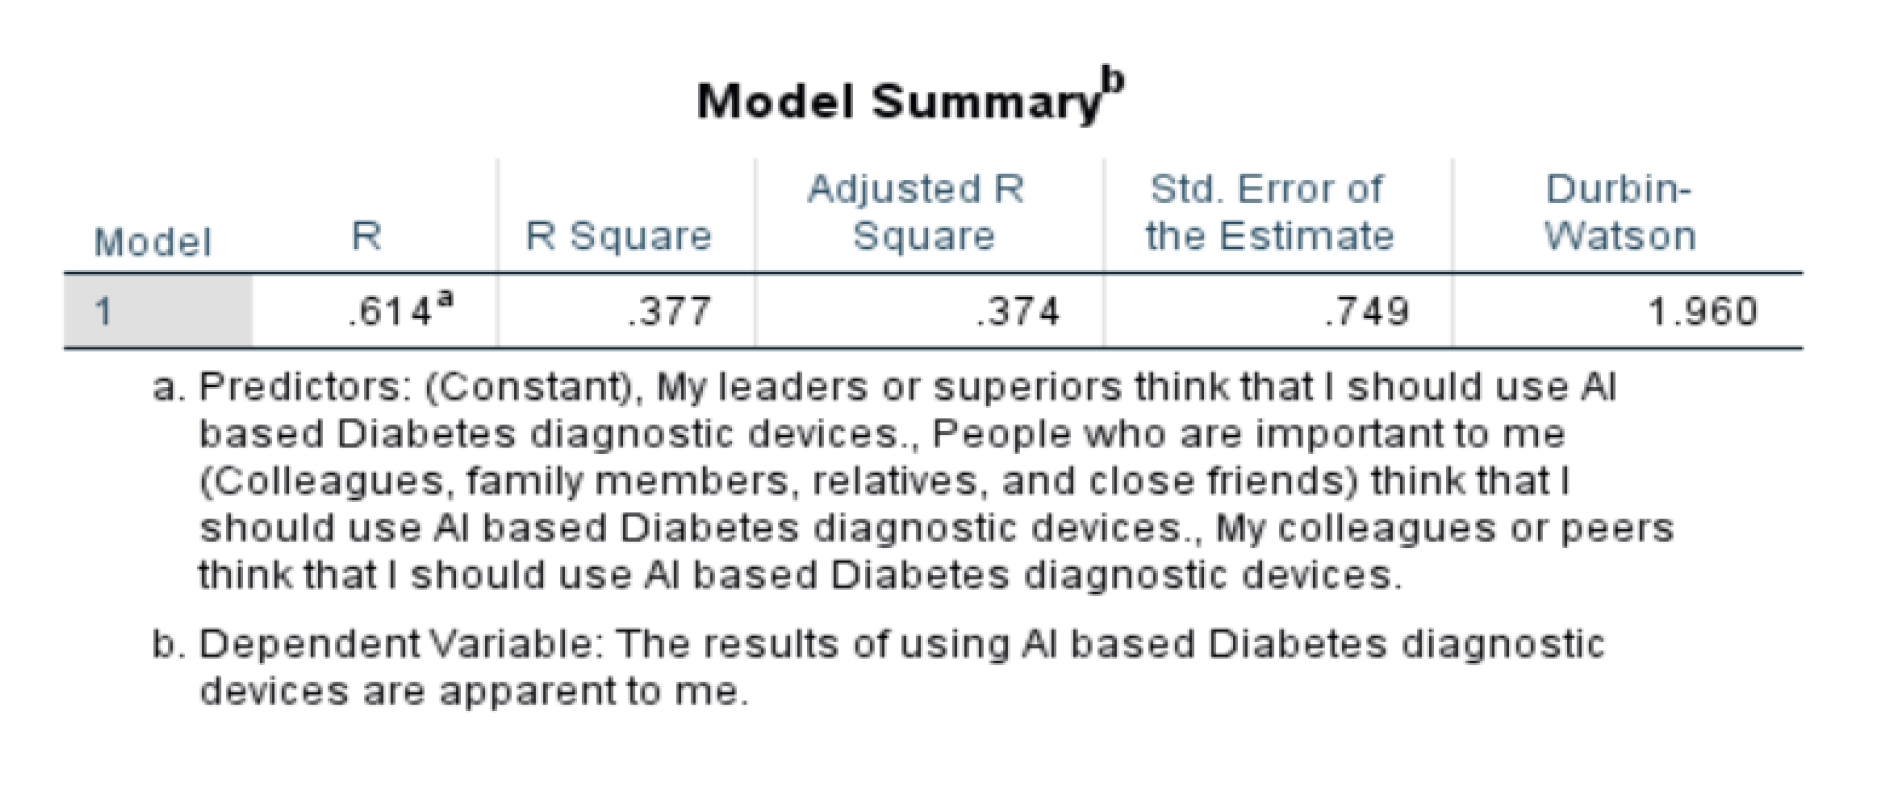
The R-squared value of the model is 0.377, which means that 37.7% of the variance in the dependent variable is explained by the independent variables in the model. The adjusted R-squared value is 0.374, which is a slight adjustment for the number of independent variables in the model.
The standard error of the estimate is 0.749. This means that the average prediction made by the model will be off by 0.749 on the dependent variable.
The Durbin-Watson statistic is 1.960. This statistic is used to test for autocorrelation in the residuals of the model. A value of 2 indicates no autocorrelation. Values less than 2 may indicate positive autocorrelation and values greater than 2 may indicate negative autocorrelation.
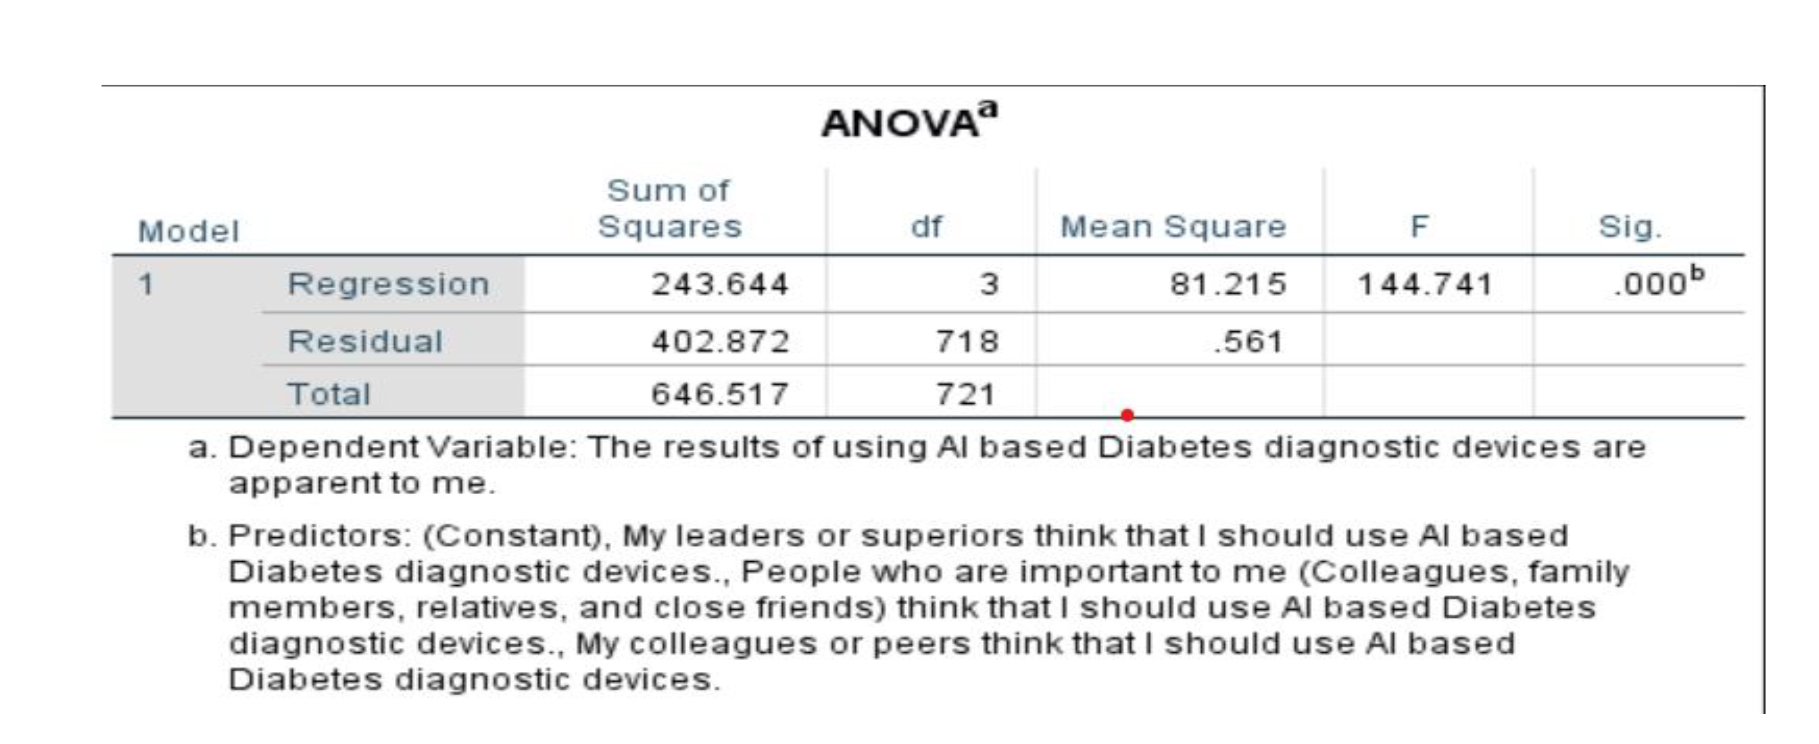
stF: This is the F-statistic. It is a test statistic that is used to compare the variance between groups to the variance within groups. A statistically significant F-statistic indicates that there is a difference between the means of the groups. The table shows that the F-statistic for this model is 144.741.
stSig.: This is the significance level. It is a p-value. A p-value less than 0.05 is typically considered to be statistically significant. The table shows that the significance level for this model is 0.000. This means that there is a statistically significant difference between the means of the four groups. Thus we can reject the null hypothesis.
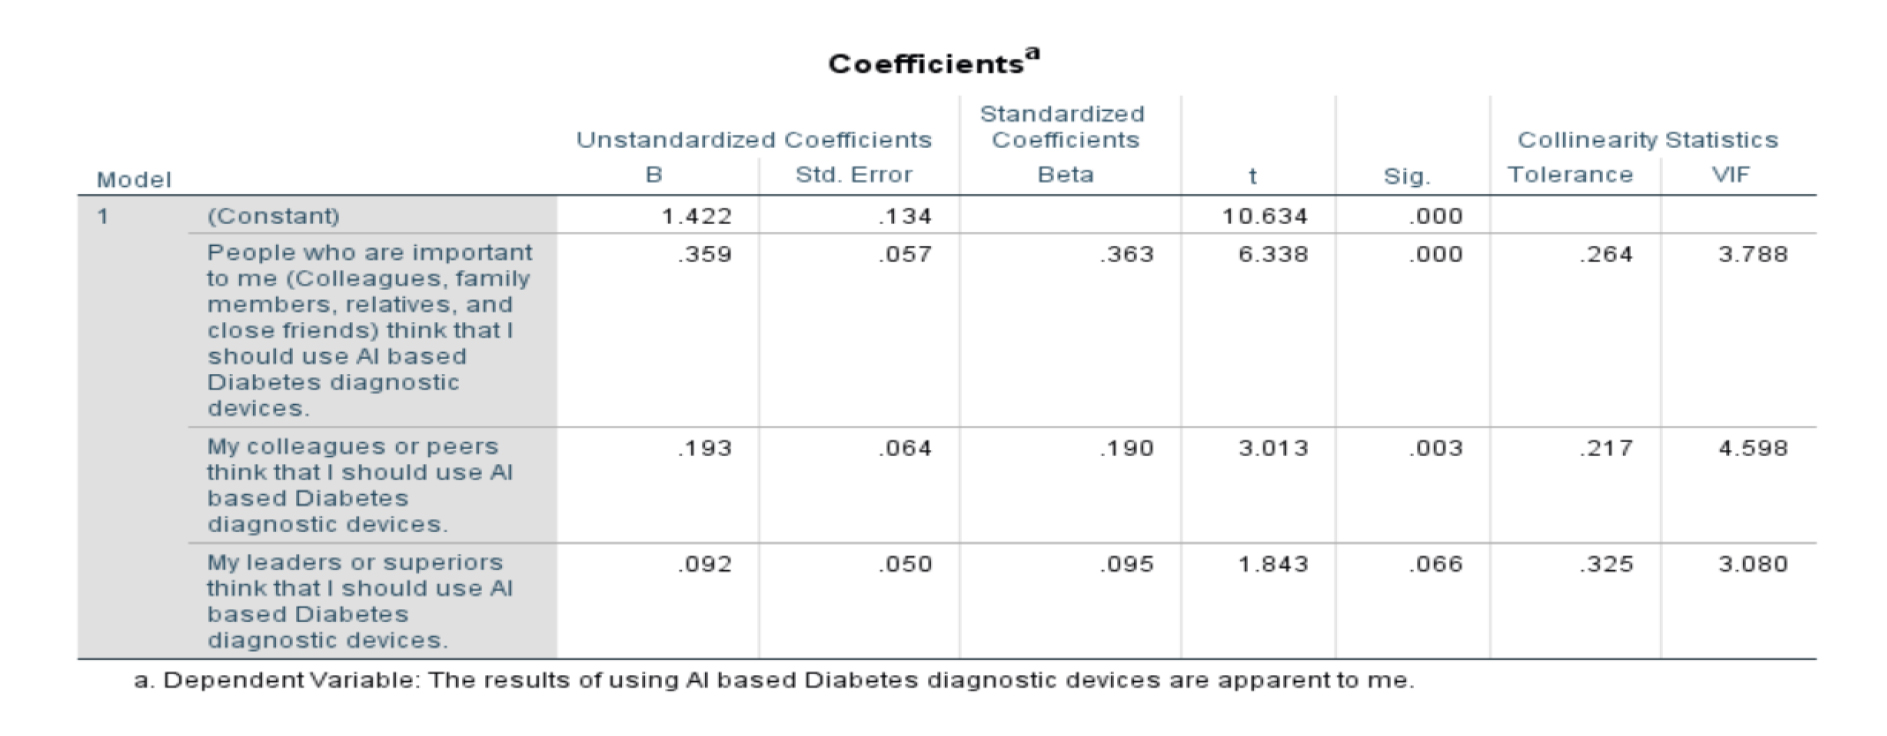
In the above table, the sig value for all three independent variables (People who are important to me..., My colleagues or peers..., My leaders or superiors...) is 0.000. This suggests that all three variables have a statistically significant relationship with the dependent variable (The results of using Al-based Diabetes diagnostic devices are apparent to me).
In the above table, the VIF values for all three independent variables are above 3 (People who are important to me... - 3.788, My colleagues or peers... - 4.598, My leaders or superiors... - 3.080). While not exceptionally high, these values do suggest that there may be some degree of multicollinearity among the independent variables.
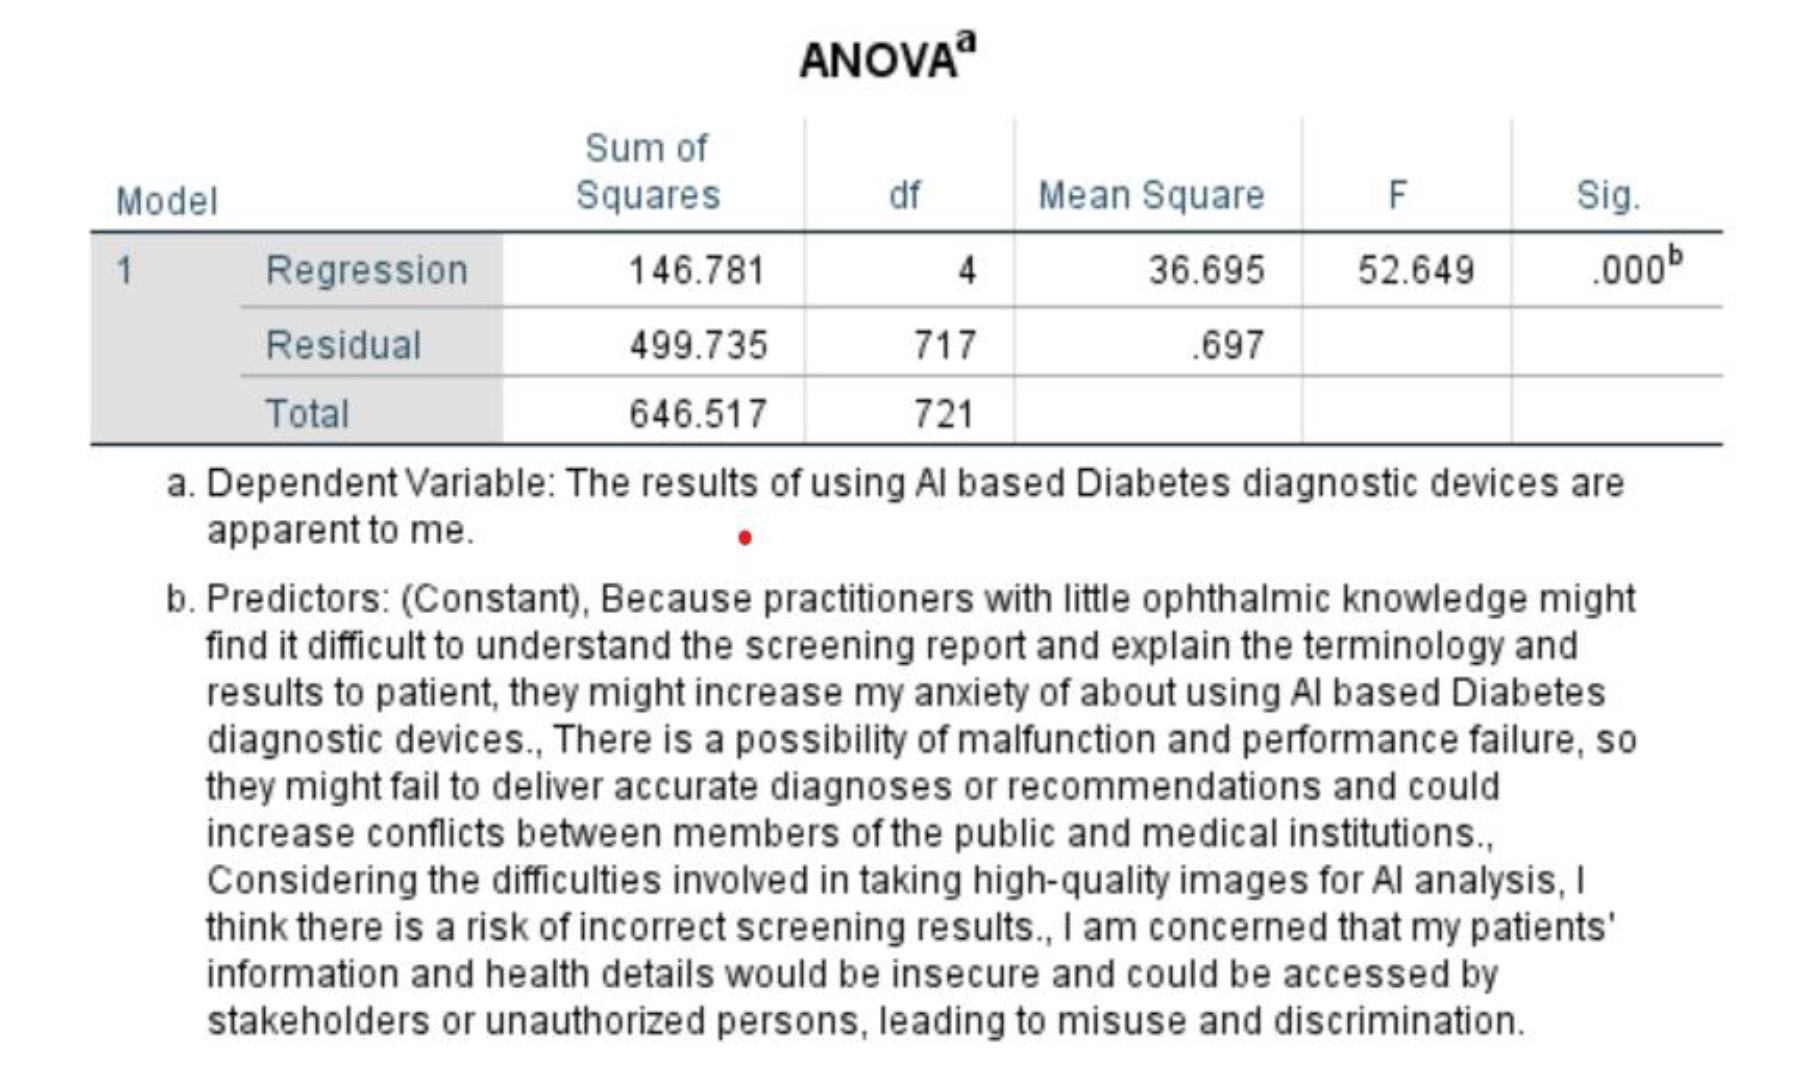
Perceived Risk
The table shows that the model is statistically significant (R-squared = 0.227), but it only explains a small amount of the variance in the data. The adjusted R-squared value is 0.223, which means that 22.3% of the variation in the results of using AI-based diabetes diagnostic devices is explained by the factors included in the model.
The p-value in the table is 0.000, which means that there is a statistically significant relationship between these concerns and the way patients view the results. Thus we reject the null hypothesis.
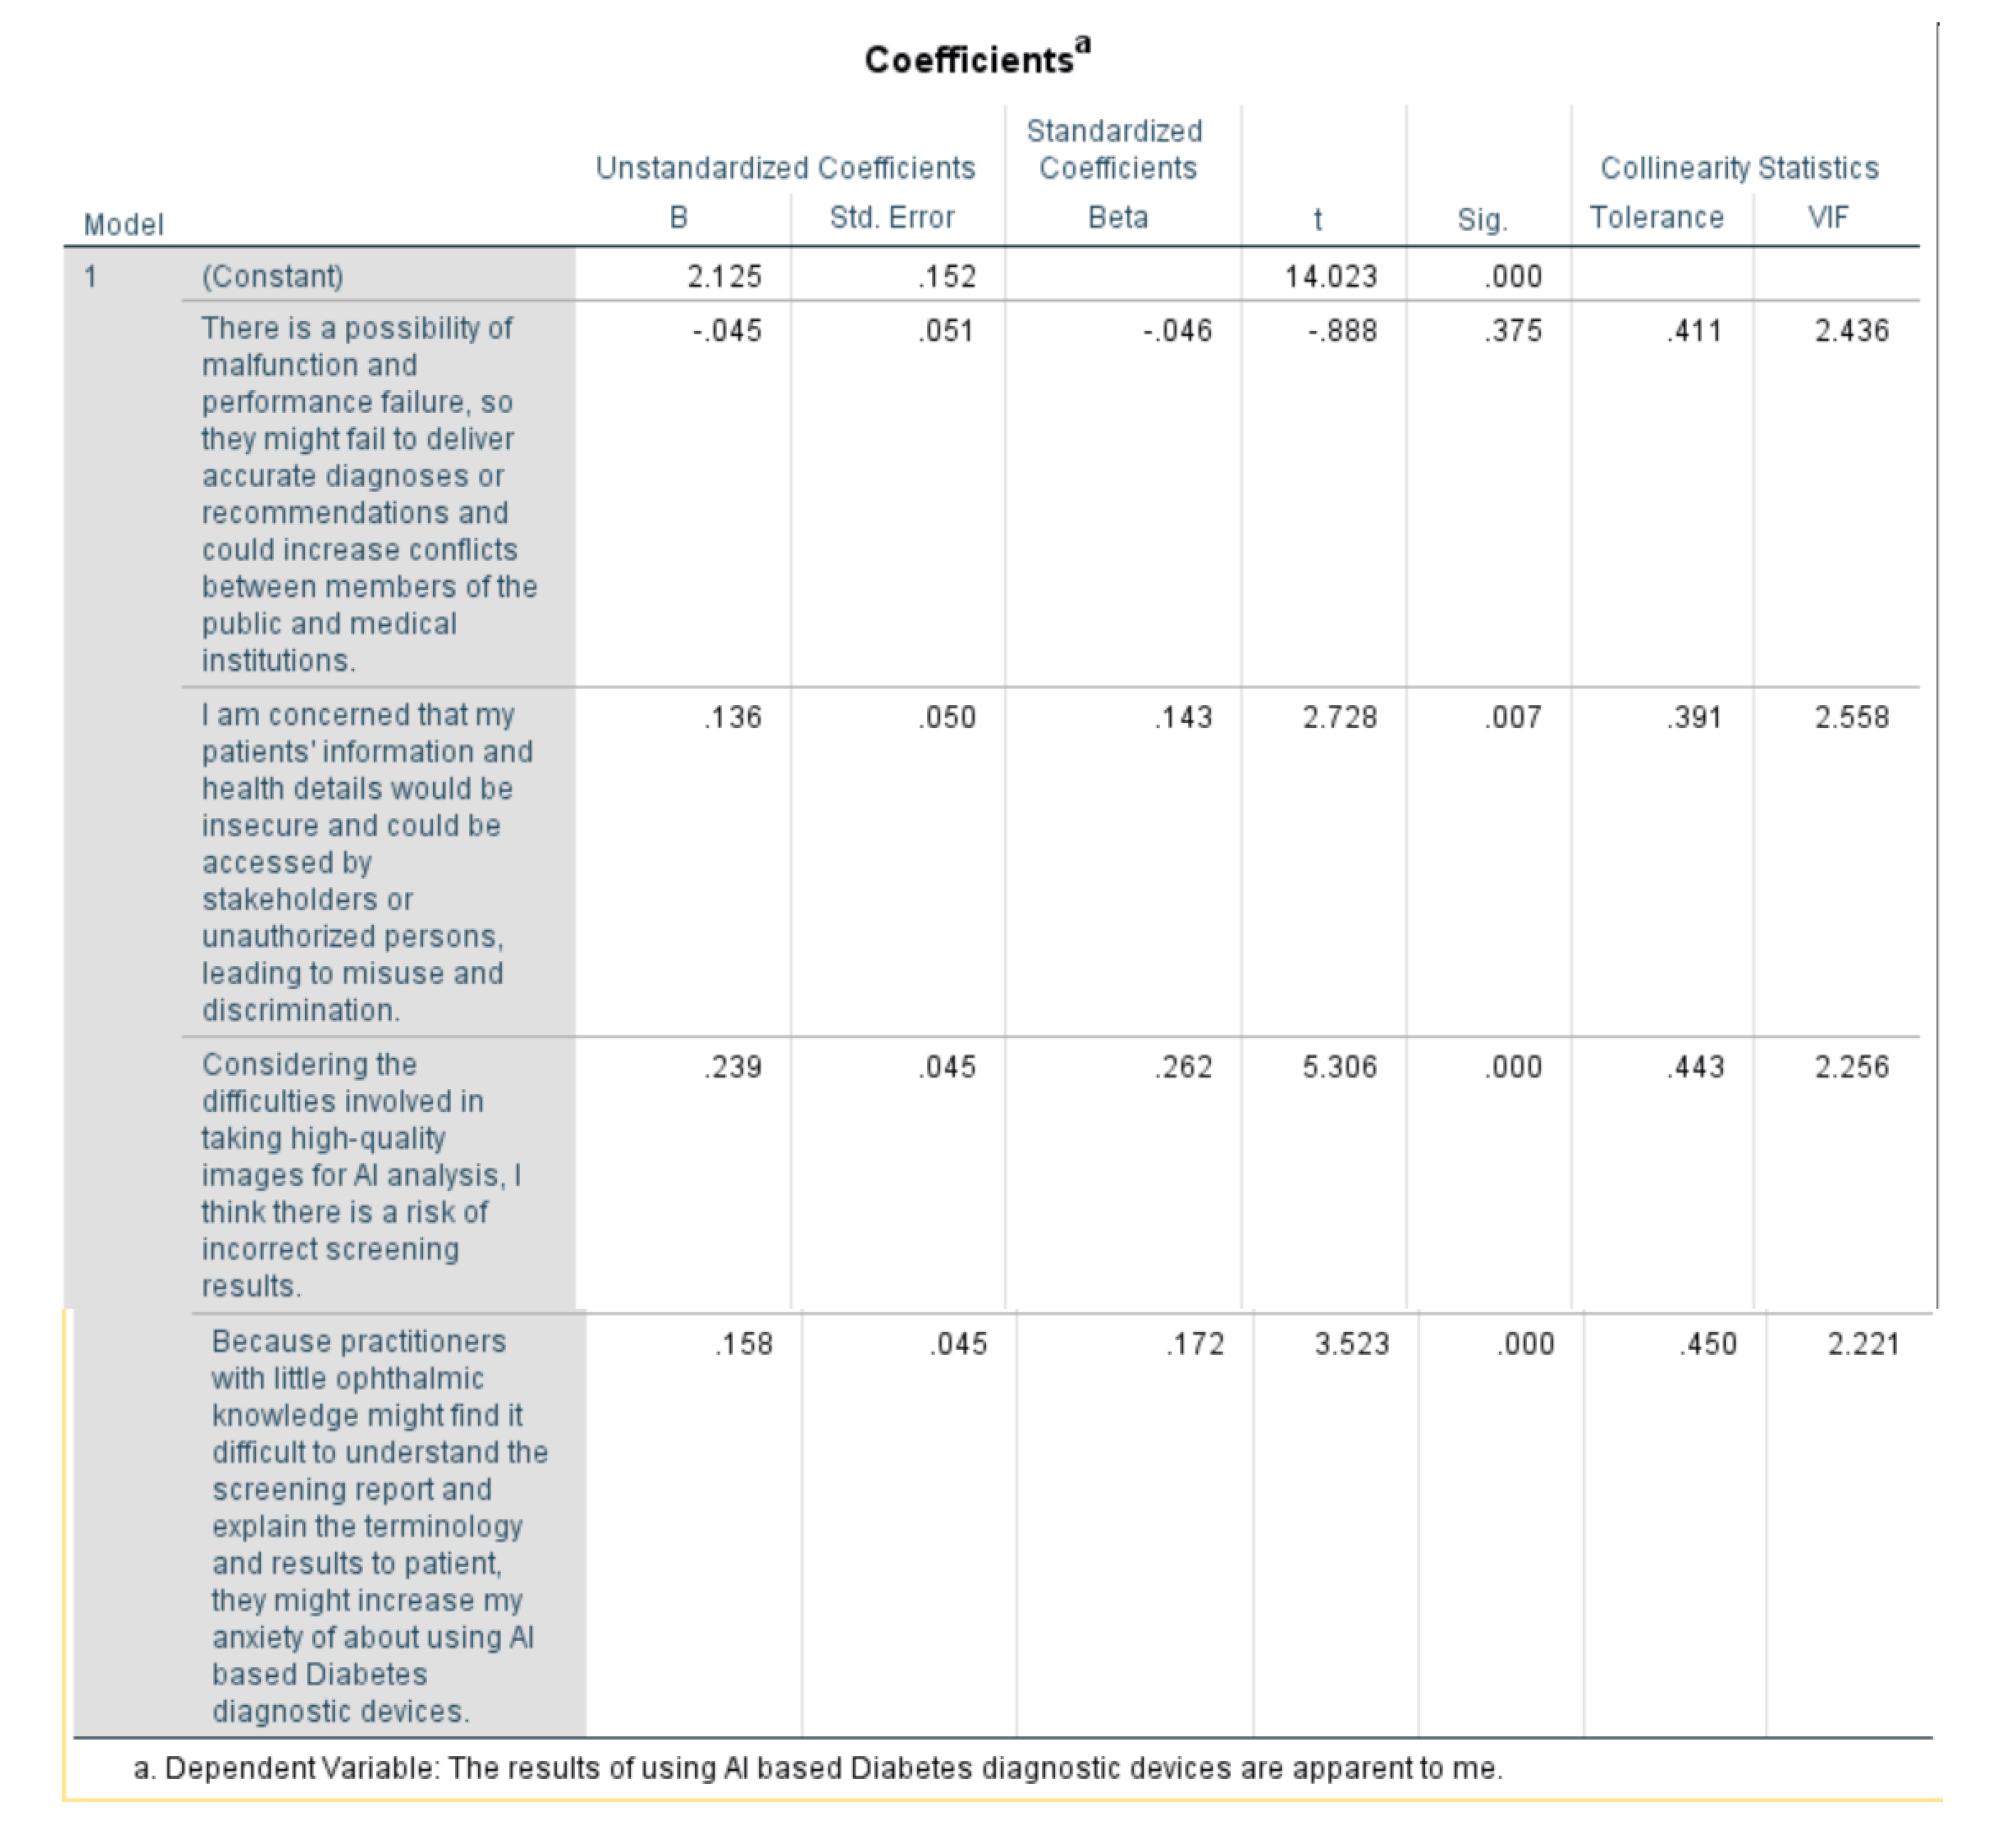
There is no significant relationship between concerns about malfunction/performance failures and your perception (Sig. = 0.375).
There is a significant relationship between concerns about data security/misuse (Sig. = 0.007), difficulty in image acquisition (Sig. = 0.000), and practitioner knowledge impacting your anxiety (Sig. = 0.000) with your perception.
A VIF value greater than 5 suggests potential multicollinearity issues. In this case:
All VIF values are below 2.56, indicating no significant multicollinearity is affecting the interpretation of the coefficients.
Conclusion
AI holds immense potential to revolutionize healthcare diagnostics in India. Studies demonstrate its effectiveness in improving diagnostic accuracy and efficiency. However, addressing data privacy concerns, promoting AI literacy and ensuring equitable access are critical for successful implementation. As India continues to develop its AI capabilities, leveraging this technology for improved healthcare diagnostics can lead to a healthier future for its citizens. While AI-based diabetes diagnostic tools hold promise for Maharashtra and Karnataka, unique considerations regarding explainability, data privacy, and workflow integration need to be addressed. Addressing these factors and ensuring a clear relative advantage over existing methods will be crucial for doctors' adoption of this innovative technology.
Implications, Future Scope, and Limitations Managerial Implications
Focus on Physician Adoption: While research exists on the development and application of AI-based diabetes diagnostic tools in India, this study specifically focuses on doctor adoption behavior. Understanding how doctors perceive and integrate these tools is crucial for successful implementation within the healthcare system.
State-Specific Analysis: Studies on healthcare technology adoption often take a national approach. Examining doctor adoption in Maharashtra and Karnataka, two states with advanced healthcare infrastructure but potential regional variations, provides valuable insights.
Enabling Factors Model: The research proposes to develop a model that identifies factors influencing doctors' adoption of AI tools. This can contribute to the existing literature on the Technology Acceptance Model (TAM) in healthcare by exploring the specific context of AI-based diabetes diagnosis in India.
Future Scope and Limitations
- Improved diagnostic accuracy and efficiency: AI can analyze vast amounts of medical data to identify patterns that humans might miss, leading to earlier and more accurate diagnoses.
- Early intervention and improved treatment outcomes: Early detection of diabetes allows for early intervention and better management of the disease, potentially reducing complications.
- Limited number of experts and research: AI is still in its nascent stage, especially in the context of healthcare. This limits the number of experts who can contribute to the extensive research required in the adoption of AI into India’s healthcare system.
- Reduced healthcare burden: AI-powered diagnostics can potentially free up doctors' time for more complex cases and improve overall healthcare efficiency.
- Accessibility in remote areas: AI-based diagnostic tools can be deployed in remote areas where access to qualified healthcare professionals is limited.
- Personalized medicine: AI can be used to develop personalized treatment plans based on individual patient data.
Limitations of AI-based Diabetes Diagnostic Interventions
- Data privacy and security concerns: Ensuring the privacy and security of sensitive patient data is critical.
- Explainability and transparency: It's important to understand how AI systems arrive at their diagnoses to ensure trust and acceptance by doctors.
- Limited access to technology and infrastructure: Unequal access to technology and internet connectivity in some regions can limit the reach of AI diagnostics.
- Integration with existing workflows: Integrating AI tools seamlessly into existing healthcare workflows is crucial for adoption.
- Cost and reimbursement: The cost of developing and implementing AI tools needs to be considered, along with establishing reimbursement models.
- Dependence on data quality: The accuracy of AI models depends on the quality of the data they are trained on.
References
- Taherdoost, H. (2018). A review of technology acceptance and adoption models and theories. Procedia Manufacturing, 22, 960–967.https://doi.org/10.1016/j.promfg.2018.03.137
- Taherdoost, H. (2019, January 8). Importance of Technology Acceptance Assessment for Successful Implementation and Development of New Technologies. Global Journal of Engineering Sciences, 1(3). https://doi.org/10.33552/gjes.2019.01.000511
- Chau, P.Y., & Hu, P.J. (2002). Investigating healthcare professionals' decisions to accept telemedicine technology: an empirical test of competing theories. Inf. Manag., 39, 297-311.
- Al-Qaysi, N., Mohamad-Nordin, N., & Al-Emran, M. (2021, August 1). Developing a comprehensive theoretical model for adopting social media in higher education. Interactive Learning Environments, 1–22. https://doi.org/10.1080/10494820.2021.1961809
- Rahimi, B., Nadri, H., Lotfnezhad Afshar, H., & Timpka, T. (2018, July). A Systematic Review of the Technology Acceptance Model in Health Informatics. Applied Clinical Informatics, 09(03), 604–634. https://doi.org/10.1055/s-0038-1668091
- Ketikidis, P., Dimitrovski, T., Lazuras, L., & Bath, P. A. (2012, June). Acceptance of health information technology in health professionals: An application of the revised technology acceptance model. Health Informatics Journal, 18(2), 124–134. https://doi.org/10.1177/1460458211435425
- Boon-itt, S. (2019, January 15). Quality of health websites and their influence on perceived usefulness, trust and intention to use: an analysis from Thailand. Journal of Innovation and Entrepreneurship, 8(1). https://doi.org/10.1186/s13731-018-0100-9
- Ahmadi, M., Mehrabi, N., Sheikhtaheri, A., & Sadeghi, M. (2017). Acceptability of picture archiving and communication systems (PACS) among hospital healthcare personnel based on a unified theory of acceptance and use of technology. Electronic physician, 9(9), 5325–5330. https://doi.org/10.19082/5325
- Gopal, P., S.A, P., V.K, M., M.L.R, V., J, M. & G.D., P. (2019). Impact of UTAUT Predictors on the Intention and Usage of Electronic Health Records and Telemedicine from the Perspective of Clinical Staffs. Innovation, Engineering and Entrepreneurship Lecture Notes in Electrical Engineering:172-177. Doi:10.1007/978-3-319-91334-6_24
- Al-Maroof, R.S., Al-Qaysi, N., Salloum, S.A., & Al-Emran, M. (2021). Blended Learning Acceptance: A Systematic Review of Information Systems Models. Technology, Knowledge and Learning, 27, 891-926.
- Yang, H., Guo, X., & Wu, T. (2015). Exploring the influence of the online physician service delivery process on patient satisfaction. Decis. Support Syst., 78, 113-121.
- Gagnon, M. P., Ngangue, P., Payne-Gagnon, J., & Desmartis, M. (2016). m-Health adoption by healthcare professionals: a systematic review. Journal of the American Medical Informatics Association: JAMIA, 23(1), 212–220. https://doi.org/10.1093/jamia/ocv052
- Zhang, X., Guo, X., Lai, K. H., Guo, F., & Li, C. (2014). Understanding gender differences in m-health adoption: a modified theory of reasoned action model. Telemedicine journal and e-health: the official journal of the American Telemedicine Association, 20(1), 39–46. https://doi.org/10.1089/tmj.2013.0092
- Hilliard, M. E., Hahn, A., Ridge, A. K., Eakin, M. N., & Riekert, K. A. (2014). User Preferences and Design Recommendations for a mHealth App to Promote Cystic Fibrosis Self-Management. JMIR mHealth and uHealth, 2(4), e44. https://doi.org/10.2196/mhealth.3599
- Mahajan, Abhishek1,4,; Vaidya, Tanvi1,4; Gupta, Anurag1,4; Rane, Swapnil2,4; Gupta, Sudeep3,4. Artificial intelligence in healthcare in developing nations: The beginning of a transformative journey. Cancer Research, Statistics, and Treatment 2(2):p 182-189, Jul–Dec 2019. | DOI: 10.4103/CRST.CRST_50_19
- Kumar, G., Singh, R.K., Arya, V. et al. Analyzing Barriers in Adoption of Artificial Intelligence for Resilient Health Care Services to Society. Glob J Flex Syst Manag 25, 179–197 (2024). https://doi.org/10.1007/s40171-024-00373-4
- Davis, F.D. (1985). A technology acceptance model for empirically testing new end-user information systems: theory and results.
- Davis, F.D. (1989). Perceived Usefulness, Perceived Ease of Use, and User Acceptance of Information Technology. MIS Q., 13, 319-340.
- Davis, F.D., Bagozzi, R.P., & Warshaw, P.R. (1989). User Acceptance of Computer Technology: A Comparison of Two Theoretical Models. Management Science, 35, 982-1003.
- Ajzen, I. (1985). From Intentions to Actions: A Theory of Planned Behavior.
- Rogers, E. M. (1982, November 1). Diffusion of Innovations. Free Press. https://doi.org/10.1604/9780029266502
- Fishbein, M., & Ajzen, I. (1975, April 1). Belief, Attitude, Intention, and Behavior. In An Introduction to Theory and Research. https://doi.org/10.1604/9780201020892
- Thompson, R.L., Higgins, C.A., & Howell, J.M. (1991). Personal Computing: Toward a Conceptual Model of Utilization. MIS Q., 15, 125-143.
- Davis, F.D., Bagozzi, R.P., & Warshaw, P.R. (1992). Extrinsic and Intrinsic Motivation to Use Computers in the Workplace1. Journal of Applied Social Psychology, 22, 1111-1132.
- Venkatesh, V., Morris, M.G., Davis, G.B., & Davis, F.D. (2003). User Acceptance of Information Technology: Toward a Unified View. Institutions & Transition Economics: Microeconomic Issues eJournal.
- Bandura A. (1977). Self-efficacy: toward a unifying theory of behavioural change. Psychological Review, 84(2), 191–215. https://doi.org/10.1037//0033-295x.84.2.191
- Bandura, A. (1978). Reflections on self-efficacy. Advances in Behaviour Research and Therapy, 1, 237-269.
- Bandura, A. (1982). Self-efficacy mechanism in human agency. American Psychologist, 37, 122-147.
- Bandura, A. (1986). Social Foundations of Thought and Action.
- Kuo, B.C.H; Roldan-Bau, Alma; and Lowinger, Robert. (2015). Psychological Help-Seeking among Latin American Immigrants in Canada: Testing a Culturally-Expanded Model of the Theory of Reasoned Action Using Path Analysis. International Journal for the Advancement of Counselling.https://scholar.uwindsor.ca/psychologypub/34
- White, K. M., Jamieson, N. L., Obst, P. L., Graves, N., Barnett, A., Cockshaw, W., Gee, P., Haneman, L., Page, K., Campbell, M., Martin, E., & Paterson, D. (2015). Using a theory of planned behaviour framework to explore hand hygiene beliefs at the '5 critical moments' among Australian hospital-based nurses. BMC health services research, 15, 59. https://doi.org/10.1186/s12913-015-0718-2
- Taherdoost, H., & Masrom, M. (2009). An examination of smart card technology acceptance using adoption model. Proceedings of the ITI 2009 31st International Conference on Information Technology Interfaces, 329-334.
- Taherdoost, H. (2018). A review of technology acceptance and adoption models and theories. Procedia Manufacturing, 22, 960-967.
- Taherdoost, H., Sahibuddin, S., & Jalaliyoon, N. (2011). Smart Card Security; Technology and Adoption.
- Taherdoost, H., Sahibuddin, S., Namayandeh, M., & Jalaliyoon, N. (2011). Propose an educational plan for computer ethics and information security. Procedia - Social and Behavioral Sciences, 28, 815–819. https://doi.org/10.1016/j.sbspro.2011.11.149
- Chang, M.K., & Cheung, W. (2001). Determinants of the intention to use Internet/WWW at work: a confirmatory study. Inf. Manag., 39, 1-14.
- Misbah, Z., Gulikers, J.T., Maulana, R., & Mulder, M. (2015). Teacher interpersonal behaviour and student motivation in competence-based vocational education: Evidence from Indonesia. Teaching and Teacher Education, 50, 79-89.
- Muk, A., & Chung, C. (2015). Applying the technology acceptance model in a two-country study of SMS advertising. Journal of Business Research, 68, 1-6.
- Lin, F., Fofanah, S. S., & Liang, D. (2011, April). Assessing citizen adoption of e-Government initiatives in the Gambia: A validation of the technology acceptance model in information systems success. Government Information Quarterly, 28(2), 271–279. https://doi.org/10.1016/j.giq.2010.09.004
- Wu, P. (2009). User Acceptance of Emergency Alert Technology: A Case Study.
- Taherdoost, H., Zamani, M., & Namayandeh, M. (2009). Study of smart card technology and probe user awareness about it: A case study of Middle Eastern students. 2009 2nd IEEE International Conference on Computer Science and Information Technology, 334-338.
- Maillet, É., Mathieu, L., & Sicotte, C. (2015). Modelling factors explaining the acceptance, actual use and satisfaction of nurses using an Electronic Patient Record in acute care settings: an extension of the UTAUT. International journal of medical informatics, 84(1), 36–47. https://doi.org/10.1016/j.ijmedinf.2014.09.004
- Igbaria, M., Schiffman, S.J., & Wieckowski, T.J. (1994). The respective roles of perceived usefulness and perceived fun in the acceptance of microcomputer technology. Behav. Inf. Technol., 13, 349-361.
- Rana, N.P., & Dwivedi, Y.K. (2015). Citizen's adoption of an e-government system: Validating extended social cognitive theory (SCT). Gov. Inf. Q., 32, 172-181.
- Sila, I. (2015). The state of empirical research on the adoption and diffusion of business-to-business e-commerce. Int. J. Electron. Bus., 12, 258-301.
- Hameed, M.A., Counsell, S., & Swift, S. (2012). A conceptual model for the process of IT innovation adoption in organizations. Journal of Engineering and Technology, 29, 358-390.
- Grellhesl, M., & Punyanunt-Carter, N. M. (2012, November). Using the uses and gratifications theory to understand gratifications sought through text messaging practices of male and female undergraduate students. Computers in Human Behavior, 28(6), 2175–2181. https://doi.org/10.1016/j.chb.2012.06.024
- Chen, C., Huang, C., Chen, M., & Ku, E.C. (2015). User's Adoption of Mobile O2O Applications: Perspectives of the Uses and Gratifications Paradigm and Service-Dominant Logic. Pacific Asia Conference on Information Systems.
- Chang, S. S., Lou, S. J., Cheng, S. R., & Lin, C. L. (2015, April 7). Exploration of usage behavioural model construction for university library electronic resources. The Electronic Library, 33(2), 292–307. https://doi.org/10.1108/el-10-2013-0195
- Bouten, M. (2008). Compatibility and technology acceptance: consolidating, validating and extending concepts (Top Thesis).
- Karahanna, E., Agarwal, R., & Angst, C.M. (2006). Reconceptualizing Compatability Beliefs in Technology Acceptance Research. MIS Q., 30, 781-804.
- Gagnon, M., Sánchez, E., & Pons, J.M. (2006). From action recommendation: psychosocial factors influencing physician intention to use Health Technology Assessment (HTA) recommendations. Implementation science: IS, 1, 8 - 8.
- Carillo, K.D. (2010). Social Cognitive Theory in IS Research - Literature Review, Criticism, and Research Agenda. International Conference on Information Systems, Technology and Management.
- Limayem, M., Khalifa, M., & Chin, W.W. (2004). Factors motivating software piracy: a longitudinal study. IEEE Transactions on Engineering Management, 51, 414-425.
- Woon, I.M., & Pee, L.G. (2004). Behavioural Factors Affecting Internet Abuse in the Workplace – An Empirical Investigation.
- Carter, L.D., & Bélanger, F. (2005). The utilization of e‐government services: citizen trust, innovation and acceptance factors *. Information Systems Journal, 15.
- Ajzen, I. (1991). The theory of planned behaviour. Organizational Behavior and Human Decision Processes, 50(2), 179–211. https://doi.org/10.1016/0749-5978(91)90020-T
- Moore, G.C., & Benbasat, I. (1991). Development of an Instrument to Measure the Perceptions of Adopting an Information Technology Innovation. Inf. Syst. Res., 2, 192-222.
- Perlusz, S. (2004). Emotions and technology acceptance: development and validation of technology affect scale. 2004 IEEE International Engineering Management Conference (IEEE Cat. No.04CH37574), 2, 845-847 Vol.2.
- Venkatesh, V. (2000). Determinants of Perceived Ease of Use: Integrating Control, Intrinsic Motivation, and Emotion into the Technology Acceptance Model. Inf. Syst. Res., 11, 342-365.
- Rogers, E. M. (1995, November 1). Diffusion of Innovations. Free Press. https://doi.org/10.1604/9780029266717
- Loewenstein, G. F., Weber, E. U., Hsee, C. K., & Welch, N. (2001). Risk as feelings. Psychological bulletin, 127(2), 267–286. https://doi.org/10.1037/0033-2909.127.2.267
- Fischhoff, B., Slovic, P., Lichtenstein, S., Read, S.J., & Combs, B. (1978). How safe is safe enough? A psychometric study of attitudes towards technological risks and benefits. Policy Sciences, 9, 127-152.
- Sjöberg L. (1998). Worry and risk perception. Risk analysis: an official publication of the Society for Risk Analysis, 18(1), 85–93. https://doi.org/10.1111/j.1539-6924.1998.tb00918.x
- MacGregor, D. (1991, June). Worry Over Technological Activities and Life Concerns. Risk Analysis, 11(2), 315–324. https://doi.org/10.1111/j.1539-6924.1991.tb00607.x
- Robinson, J.A. (2010). Triandis' theory of interpersonal behaviour in understanding software piracy behaviour in the South African context.
- Segars, A.H., & Grover, V. (1998). Strategic Information Systems Planning Success: An Investigation of the Construct and Its Measurement. MIS Q., 22, 139-163.
- Adams, D.A., Nelson, R.R., & Todd, P.A. (1992). Perceived Usefulness, Ease of Use, and Usage of Information Technology: A Replication. MIS Q., 16, 227-247.
- Davis, F.D., Bagozzi, R.P., & Warshaw, P.R. (1989). User Acceptance of Computer Technology: A Comparison of Two Theoretical Models. Management Science, 35, 982-1003.
- Goode, S. (2005). Exploring the Factors of Innovation Rejection.
- Ajzen, I. (1991). The Theory of Planned Behavior. Organizational Behavior and Human Decision Processes, 50, 179-211.https://doi.org/10.1016/0749-5978(91)90020-T
- Cheng, J. Z., Ni, D., Chou, Y. H., Qin, J., Tiu, C. M., Chang, Y. C., Huang, C. S., Shen, D., & Chen, C. M. (2016). Computer-Aided Diagnosis with Deep Learning Architecture: Applications to Breast Lesions in US Images and Pulmonary Nodules in CT Scans. Scientific reports, 6, 24454. https://doi.org/10.1038/srep24454
- Agarwal, R., & Prasad, J. (1997). The Role of Innovation Characteristics and Perceived Voluntariness in the Acceptance of Information Technologies. Decision Sciences, 28, 557-582.
- Hartwick, J.M., & Barki, H. (1994). Explaining the Role of User Participation in Information System Use. Management Science, 40, 440-465.
- Moore, G.C., & Benbasat, I. (1991). Development of an Instrument to Measure the Perceptions of Adopting an Information Technology Innovation. Inf. Syst. Res., 2, 192-222.
- Kiesler, C. A. & Kiesler, S. B. (1969). Conformity. Addison-Wesley, Reading, MA.
- Pfeffer J. (1982). Organizations and organization theory. Pitman. Retrieved January 31 2023 from http://books.google.com/books?id=xVm3AAAAIAAJ.
- Kieras, D., & Polson, P. G. (1985, April). An approach to the formal analysis of user complexity. International Journal of Man-Machine Studies, 22(4), 365–394. https://doi.org/10.1016/s0020-7373(85)80045-6
- Venkatesh, V. (1999, June). Creation of Favorable User Perceptions: Exploring the Role of Intrinsic Motivation. MIS Quarterly, 23(2), 239. https://doi.org/10.2307/249753
- Venkatesh, V., & Davis, F. D. (2000). A Theoretical Extension of the Technology Acceptance Model: Four Longitudinal Field Studies. Management Science, 46(2), 186–204. https://doi.org/10.1287/mnsc.46.2.186.11926
- Fishbein, M., & Ajzen, I. (1975, April 1). Belief, Attitude, Intention, and Behavior. In An Introduction to Theory and Research. https://doi.org/10.1604/9780201020892
- Cohen, E.B., & Nycz, M. (2006). Learning Objects and E-Learning: an Informing Science Perspective. Interdisciplinary Journal of e-Learning and Learning Objects, 2, 23-34.
- Hair, J.F., Sarstedt, M., Ringle, C.M., & Mena, J.A. (2012). An assessment of the use of partial least squares structural equation modelling in marketing research. Journal of the Academy of Marketing Science, 40, 414-433.
- Alamri, M.M., Almaiah, M.A., & Al-rahmi, W.M. (2020). Social Media Applications Affecting Students’ Academic Performance: A Model Developed for Sustainability in Higher Education. Sustainability.
- Chow, Y. S., & Teicher, H. (2012, December 6). Probability Theory. In Independence Interchangeability Martingales. https://doi.org/10.1007/978-1-4684-0062-5
- Fornell, C., & Larcker, D.F. (1981). Evaluating structural equation models with unobservable variables and measurement error. Journal of Marketing Research, 18, 39-50.